


You bring the question.
Drag and drop your data file. Set your goal and variables. You contribute the context and knowledge of your field; no coding or statistics expertise is required.

OptiMod automates scientific data analysis, turning complex data into clear, defensible evidence. Understand the findings, the uncertainty and the reasoning—for decisions in research, business and public policy.

Adjusted association for light rain or snow compared with clear weather.
95% confidence interval · 38%–60% lower
Scientific data analysis should be within everyone’s reach.
Organisations collect more data than their statistical specialists can examine. OptiMod puts that expertise into software, so researchers and domain teams can investigate their own questions.
General-purpose AI language models are not a substitute for a scientific validation system. OptiMod evaluates the data and model assumptions, compares suitable methods and documents the calculations behind each finding.
Drag and drop your data file. Set your goal and variables. You contribute the context and knowledge of your field; no coding or statistics expertise is required.
Data preparation, method requirements, assumption checks, model comparison and analysis—all handled automatically, with the reasoning recorded.
Understand the findings and their uncertainty. Keep the Scientific Report with the methods, named tests and analytical decisions behind the result.
OptiMod combines mathematical and logical reasoning with targeted AI assistance. It evaluates your actual data, tests the requirements of candidate methods and selects the best-supported model for your question. Automatically.
OptiMod examines data quality, variable types, distributions and relationships. It prepares the dataset and records each change.
Mathematical and logical checks establish which methods fit the data and the question. Model assumptions are part of this evaluation from the start.
OptiMod compares eligible models using fit, diagnostic evidence and the analytical objective. The selected model comes with a documented scientific rationale.
Estimates, uncertainty and interpretation stay connected to the calculations behind them. Each finding can be traced back to its data, methods and checks.
of researchers surveyed had tried and failed to reproduce another scientist’s experiments.
Survey of 1,576 researchers · Nature, 2016Our ambition is to make scientific scrutiny routine. When statistical expertise is available within the workflow, researchers can move from experiment to finding with the evidence that reviewers need to examine it.
Researchers gain access to the statistical checks their work calls for, even when their department has limited specialist capacity.
Collaborators and reviewers can examine assumptions, uncertainty and the rationale for a finding, then judge which conclusions the evidence supports.
The Scientific Report connects each finding to its analytical choices. Other teams can revisit the work and use it as a basis for further research.
Mathematical and logical checks establish which methods fit the data. Model choice is backed by diagnostic and statistical evidence.
AI helps make the process efficient and the findings understandable. Explanations stay connected to the calculations and checks behind them.
Drag and drop your data file and set your goal. OptiMod handles the scientific analysis automatically, then explains the findings and documents how it reached them.
Daily demand analysisExample datasetDrag in your dataset. No coding or statistics expertise needed.
CSV, Excel & more · your analysis starts here
✓ 731 records recognized · source retainedTry it: drag the example file here, or click to use it.| Date | Daily rides | Weather |
|---|---|---|
| 01 Jan 2011 | 985 | Mist / cloudy |
| 02 Jan 2011 | 801 | Mist / cloudy |
| 03 Jan 2011 | 1,349 | Clear |
Three rows from the original public dataset. Your source file stays unchanged.
Choose what to explain and which variables to consider. OptiMod determines the statistical approach.
How is weather associated
with bike-sharing demand?
OptiMod evaluates the data and method requirements, compares eligible models and computes the results.
731 records checked. Leakage and redundant columns excluded.
Count models compared against the data and diagnostic evidence.
Confidence intervals, sensitivity checks and remaining limits recorded.
Weather is associated with daily demand, after accounting for other variables.
Estimated association in this dataset.
95% interval: 38%–60% lower.
Model-based comparison; other variables held fixed. Clear weather = 100.
This is an association, not proof of cause and effect. Model limits remain part of the analysis.
From model assumptions to named statistical tests: the scientific record behind your result.
SCIENTIFIC REPORTData. Methods. Evidence.
The question, source data and preparation.
Test names, statistics, p-values and interpretation.
Findings, uncertainty and limitations.
Keep and share the record independently of access to OptiMod.
Drop in your data. OptiMod handles the scientific analysis once you set the goal.
Real public dataInterface preview, in final development. The example uses real public data and independently computed results. Playback illustrates the analysis and report export workflow.
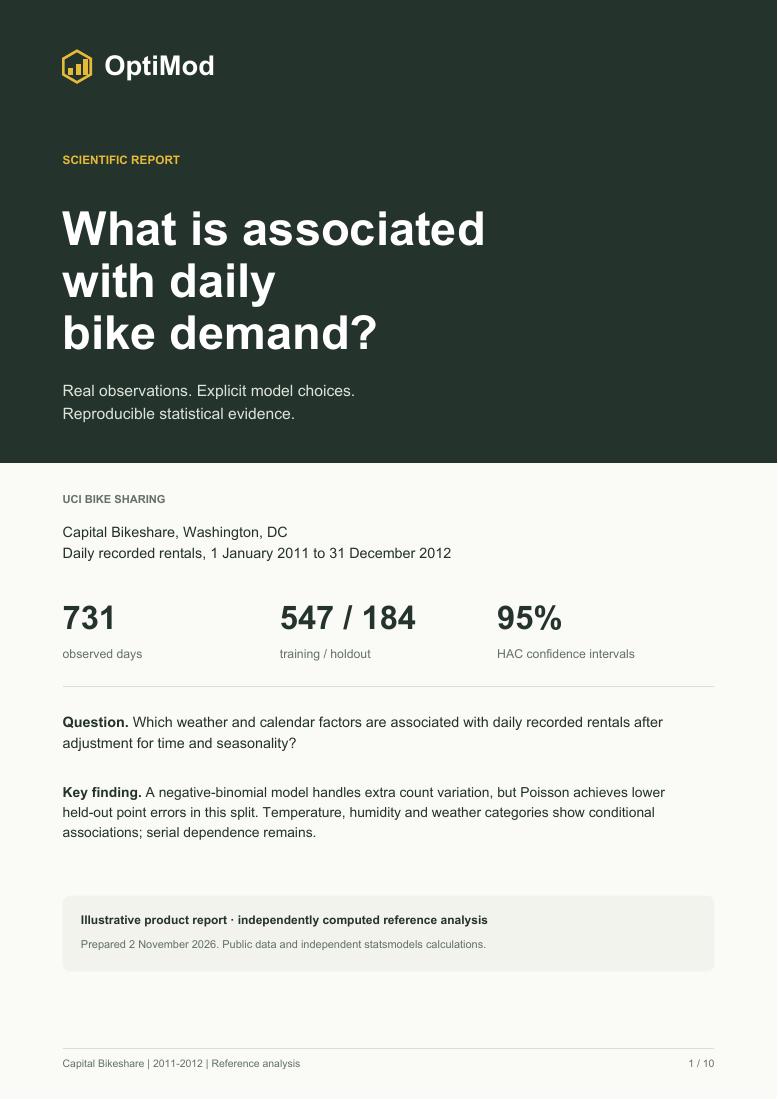
731 days of recorded bike-sharing demand in Washington, DC, from January 2011 to December 2012.
The preview uses readable column labels. The downloadable CSV preserves the original names and normalized units.
Download the original CSVAn explanatory analysis of conditional relationships, using observed daily weather and calendar data.
cnt · daily rental countcasual and registered already sum to the outcome; instant is an identifier; atemp duplicates temperature information.The question and setup are fixed for this example. This is not a future-weather forecast or an estimate of causal effects.
The checks make scientific choices visible. They also retain findings that need judgement.
All 731 rows are retained. No missing values are imputed and no outliers are silently removed. Two target-leakage columns and a redundant temperature variable are excluded.
One humidity reading is zero (10 March 2011). It is flagged and the analysis is repeated without it as a sensitivity check. Temperature stays in normalized source units because archive metadata conflict.
Poisson and Negative Binomial (NB2) are fitted to 547 training days. Training AIC is 66,197.6 for Poisson and 8,815.7 for NB2. Poisson dispersion is 109.20, indicating marked extra variation relative to its variance assumption.
NB2 is selected for the association analysis. Poisson has the lower prediction error in the 184-day holdout: 689 versus 863 rides/day. Model selection follows the question, not a universal winner.
Coefficient intervals use 7-lag HAC covariance. Residual lag-1 correlation remains 0.387; this adjustment does not remove model limitations. Weather category 3 contains only 21 days. Study design, measurement and transfer to other settings still require review.
Light rain or snow is associated with a 50.4% lower expected daily count than clear weather, conditional on the included variables.
The chart shows adjusted count ratios, not raw average demand. The mist/cloudy estimate is 0.910. These exploratory associations have no multiplicity adjustment and do not establish causation.
Held-out prediction error uses a model fitted to the first 547 days. Its NB2 MAE is 863 rides/day and RMSE is 1,123; Poisson has a lower MAE of 689. The 184 held-out days use realized weather, not weather forecasts.
An exact record of the calculation: the question checked, the procedure used, its numerical result and the interpretation.
| Question / assumption | Test or diagnostic | Result |
|---|---|---|
| Residual autocorrelation through 7 daily lags | Ljung–Box Q df = 7 | Q = 251.9104 p = 1.0863 × 10−50 Dependence detected |
| Residual autocorrelation through 14 daily lags | Ljung–Box Q df = 14 | Q = 258.9912 p = 3.9574 × 10−47 Dependence detected |
| Can the mean-model coefficients be estimated? | Design-matrix rank | 26 of 26 columns Full rank · no p-value |
| Is Poisson variance consistent with the observed variation? | Pearson dispersion Training model | 109.20 Marked overdispersion · diagnostic, not a formal p-value test |
The Ljung–Box null is no residual autocorrelation through the stated lag. Both reference checks indicate remaining dependence. Here they are descriptive residual checks using model_df = 0, not definitive NB2 specification tests.
Seven-lag HAC covariance is used for coefficient uncertainty. It does not remove the dependence or guarantee that the model is correctly specified. The report preserves this finding alongside the model choice and results.
The Scientific Report records the model choice, the assumptions tested and the uncertainty behind the finding. Keep the PDF and share it independently of access to OptiMod.
Includes source data, analysis code and dependency versions.
Individuals gain access to scientific analysis without needing statistical expertise. For platform providers, the opportunity is to bring the same capability into software, data workflows and AI systems.
Upload your data and set your goal. OptiMod handles the statistical work automatically, evaluating the data and method requirements to select a suitable analysis. Get understandable findings and a Scientific Report.
Your analysis
Understand what influences my outcome.
Data preparation, assumption checks and evidence-led model selection.
What the results mean, how certain they are and what to consider.
Connect OptiMod’s scientific core to analytics platforms, enterprise software, research systems and AI assistants. Explore bringing automated analysis and traceable findings into your own products and workflows.
Research, organisations and public institutions face different decisions. Each needs an analysis whose method, uncertainty and limitations can be understood.
Turn experimental data into scientifically grounded findings. OptiMod handles model evaluation, statistical checks and interpretation, with a clear analytical record for collaborators and publication.
Structure exploratory analyses and prioritise hypotheses for further investigation. Pharma Intelligence provides an active research setting for this direction.
Compare explanations, examine uncertainty and bring documented evidence into commercial planning.
Identify relationships worth investigating and give technical teams a shared statistical basis for process reviews.
Analyse flood exposure, population vulnerability and infrastructure data to inform national investment priorities. Make the assumptions, uncertainty and reasoning behind each conclusion explicit—so decisions affecting lives, critical infrastructure and public resources can be scrutinised and explained.
Document estimates, model choices and uncertainty so analytical conclusions can be examined in internal review.
Explore embedding method evaluation, assumption checks and documented statistical findings into the software people already use. Give users a clear explanation and the scientific record behind it.
OptiMod emerged from Leibniz University Hannover’s ITE. Today, it leads Pharma Intelligence, connecting scientific software development with AI-assisted pharmaceutical research.

Founded by brothers Ylli and Drini Morina, bringing business development and quantitative research into one team.

Studied Computer Science at Georg-August University of Göttingen. He leads OptiMod’s business development and strategic partnerships, turning its scientific foundation into a clear product and business opportunity.
Connect with the team
Studied Statistics at Georg-August University of Göttingen and is a researcher at Leibniz University Hannover. His work connects data science, innovation research and statistical methodology.
Academic backgroundFor institutions with demanding privacy, security and data sovereignty requirements. OptiMod supports hosting in Germany and deployment entirely within your organisation’s own infrastructure.
Discuss institutional requirementsHosted in Germany, with GDPR-compliant data processing. OptiMod supports institutions with high requirements for privacy, security and control over their data.
Your data is never used to train AI models. When your analysis is complete, the data used to produce the results is deleted from the servers.
OptiMod can run on your own servers or computers. For sensitive environments, analysis stays within your infrastructure and your data stays with you.